Assignments (Each student finishes each assignment alone)
1. Data processing and visualization: 10%
2. System TroubleShooting: 15%
Project (A team of 2-3 students finishes the project together)
3. Root Cause Localization with Data from AIOps Challenge: 65%
Syllabus: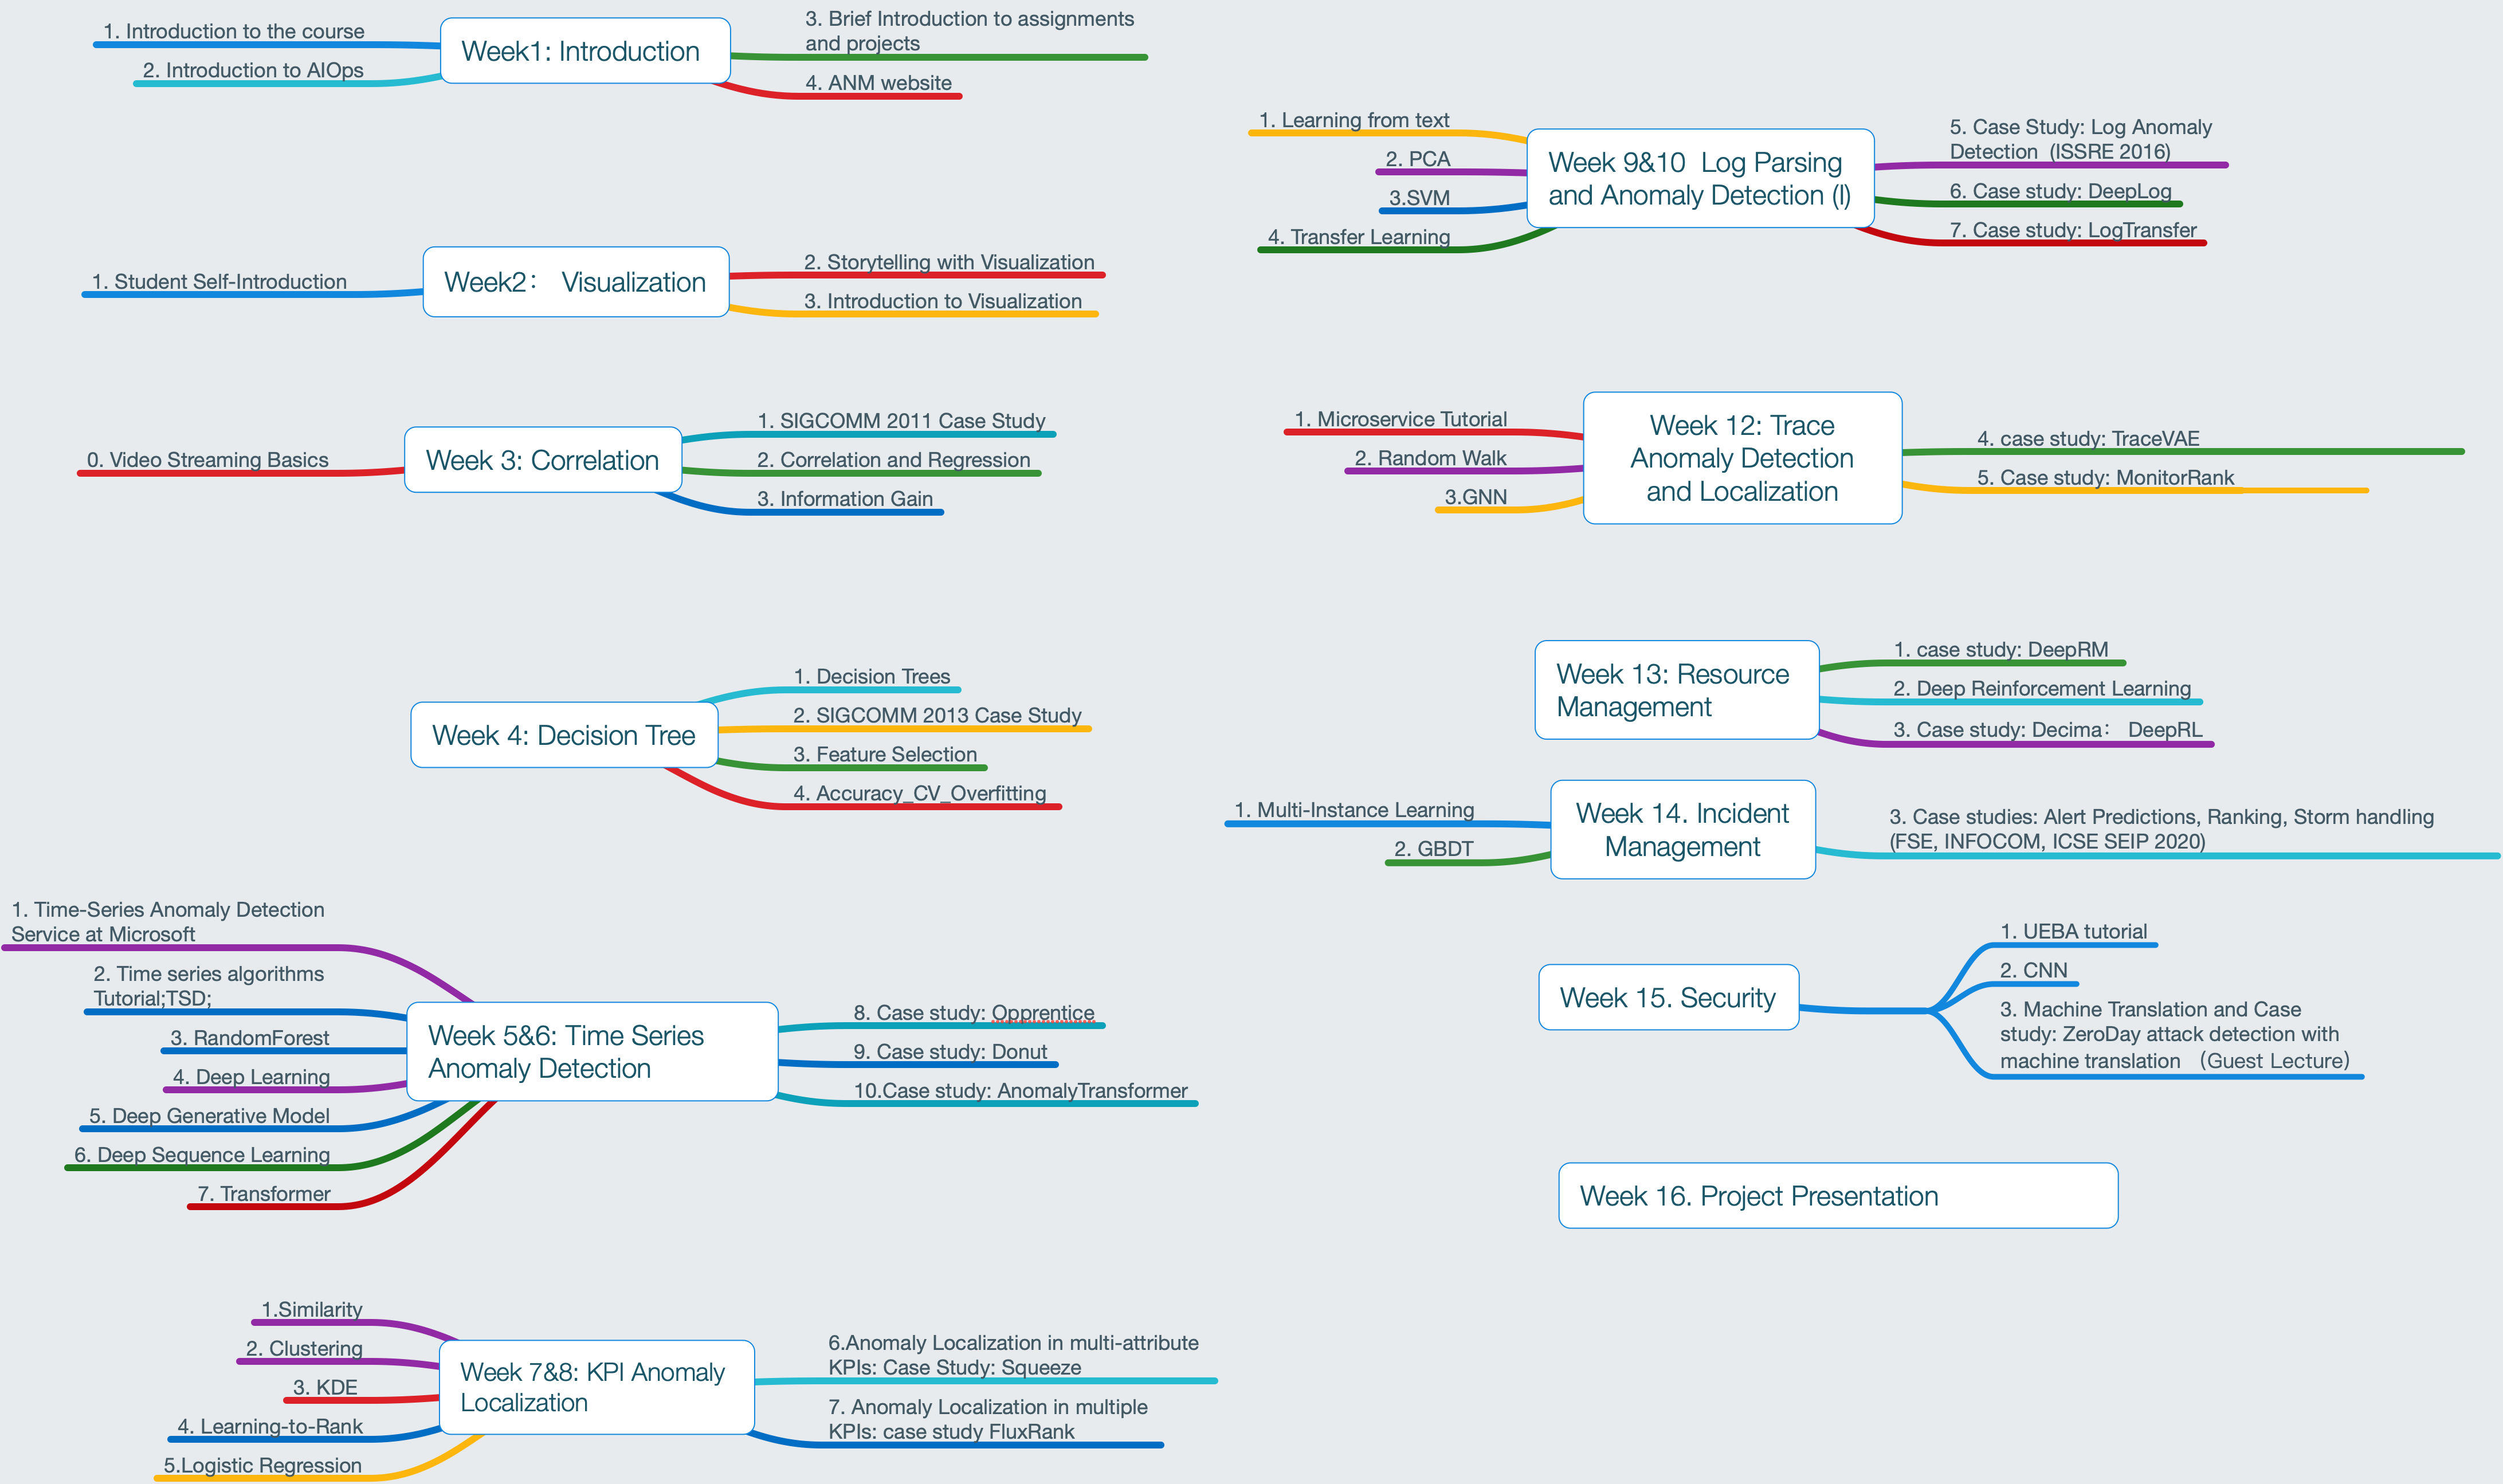
| Week | Date | Topic, Papers, Slides and Reading List | Algorithms & Techniques |
| 1 | Feb 21 (7:20 pm-9:45pm) | Course Introduction | |
| 2 | Feb 28 (7:20 pm-9:45pm) | Video streaming | Data Visualization
Correlation, Regression, Information gain, Decision trees, Regression trees
|
| 3 | Mar 7 (7:20 pm-9:45pm) | ||
| 4 | Mar 14 (7:20 pm-9:45pm) | ||
| 5 | Mar 21 (7:20 pm-9:45pm) | KPI Anomaly detection | Time series Algorithms. |
| 6 | Mar 28 (7:20 pm-9:45pm) | ||
| 7 | Apr 4 (7:20 pm-9:45pm) | KPI Anomaly Localization | Similarity |
| 8 | Apr 11(7:20 pm-9:45pm) | ||
| 9 | Apr 18 (7:20 pm-9:45pm) | Log Anomaly Detection | |
| 10 | Apr 25 (7:20 pm-9:45pm) | ||
| 11 | May 2 (No class due to school holidays) | ||
| 12 | May 9 (7:20 pm-9:45pm) | Trace Anomaly Detection and Localization | Random Walk |
| 13 | May 16 (7:20 pm-9:45pm) | Incident Management | Multi-Instance-Learning |
| 14 | May 23 (7:20 pm-9:45pm) | Resource Management | |
| 15 | May 30 (7:20 pm-9:45pm) | Signatureless Security | Neural Machine Translation |
| 16 | Jun 6 (7:20 pm-9:45pm) | Project Presentation |