Course Instructor
Dan Pei
Associate Professor
Department of Computer Science and Technology
Email: peidan(at)tsinghua(dot)edu(dot)cn
Office: East Main Building 9-319
Class Time and Location
Class Time: Wednesday 9:50am – 12:15pm (please see detailed schedule in the course syllabus below)
Location: 三教3507 (Room 3507, Teaching Building 3)
Project: Time Series Forecasting Paper Reading and Reproduction
The entire class collaboratively completes a time series forecasting benchmark. Each student will be assigned papers related to time series forecasting. After carefully reading the papers, students are required to reproduce the code and complete a benchmark report.
Grading Policies
- Attendance: 10%
- Paper Reading & Presentation: 20%
- Algorithm Reproduction & Project Presentation: 40%:
- Report Writing: 30%
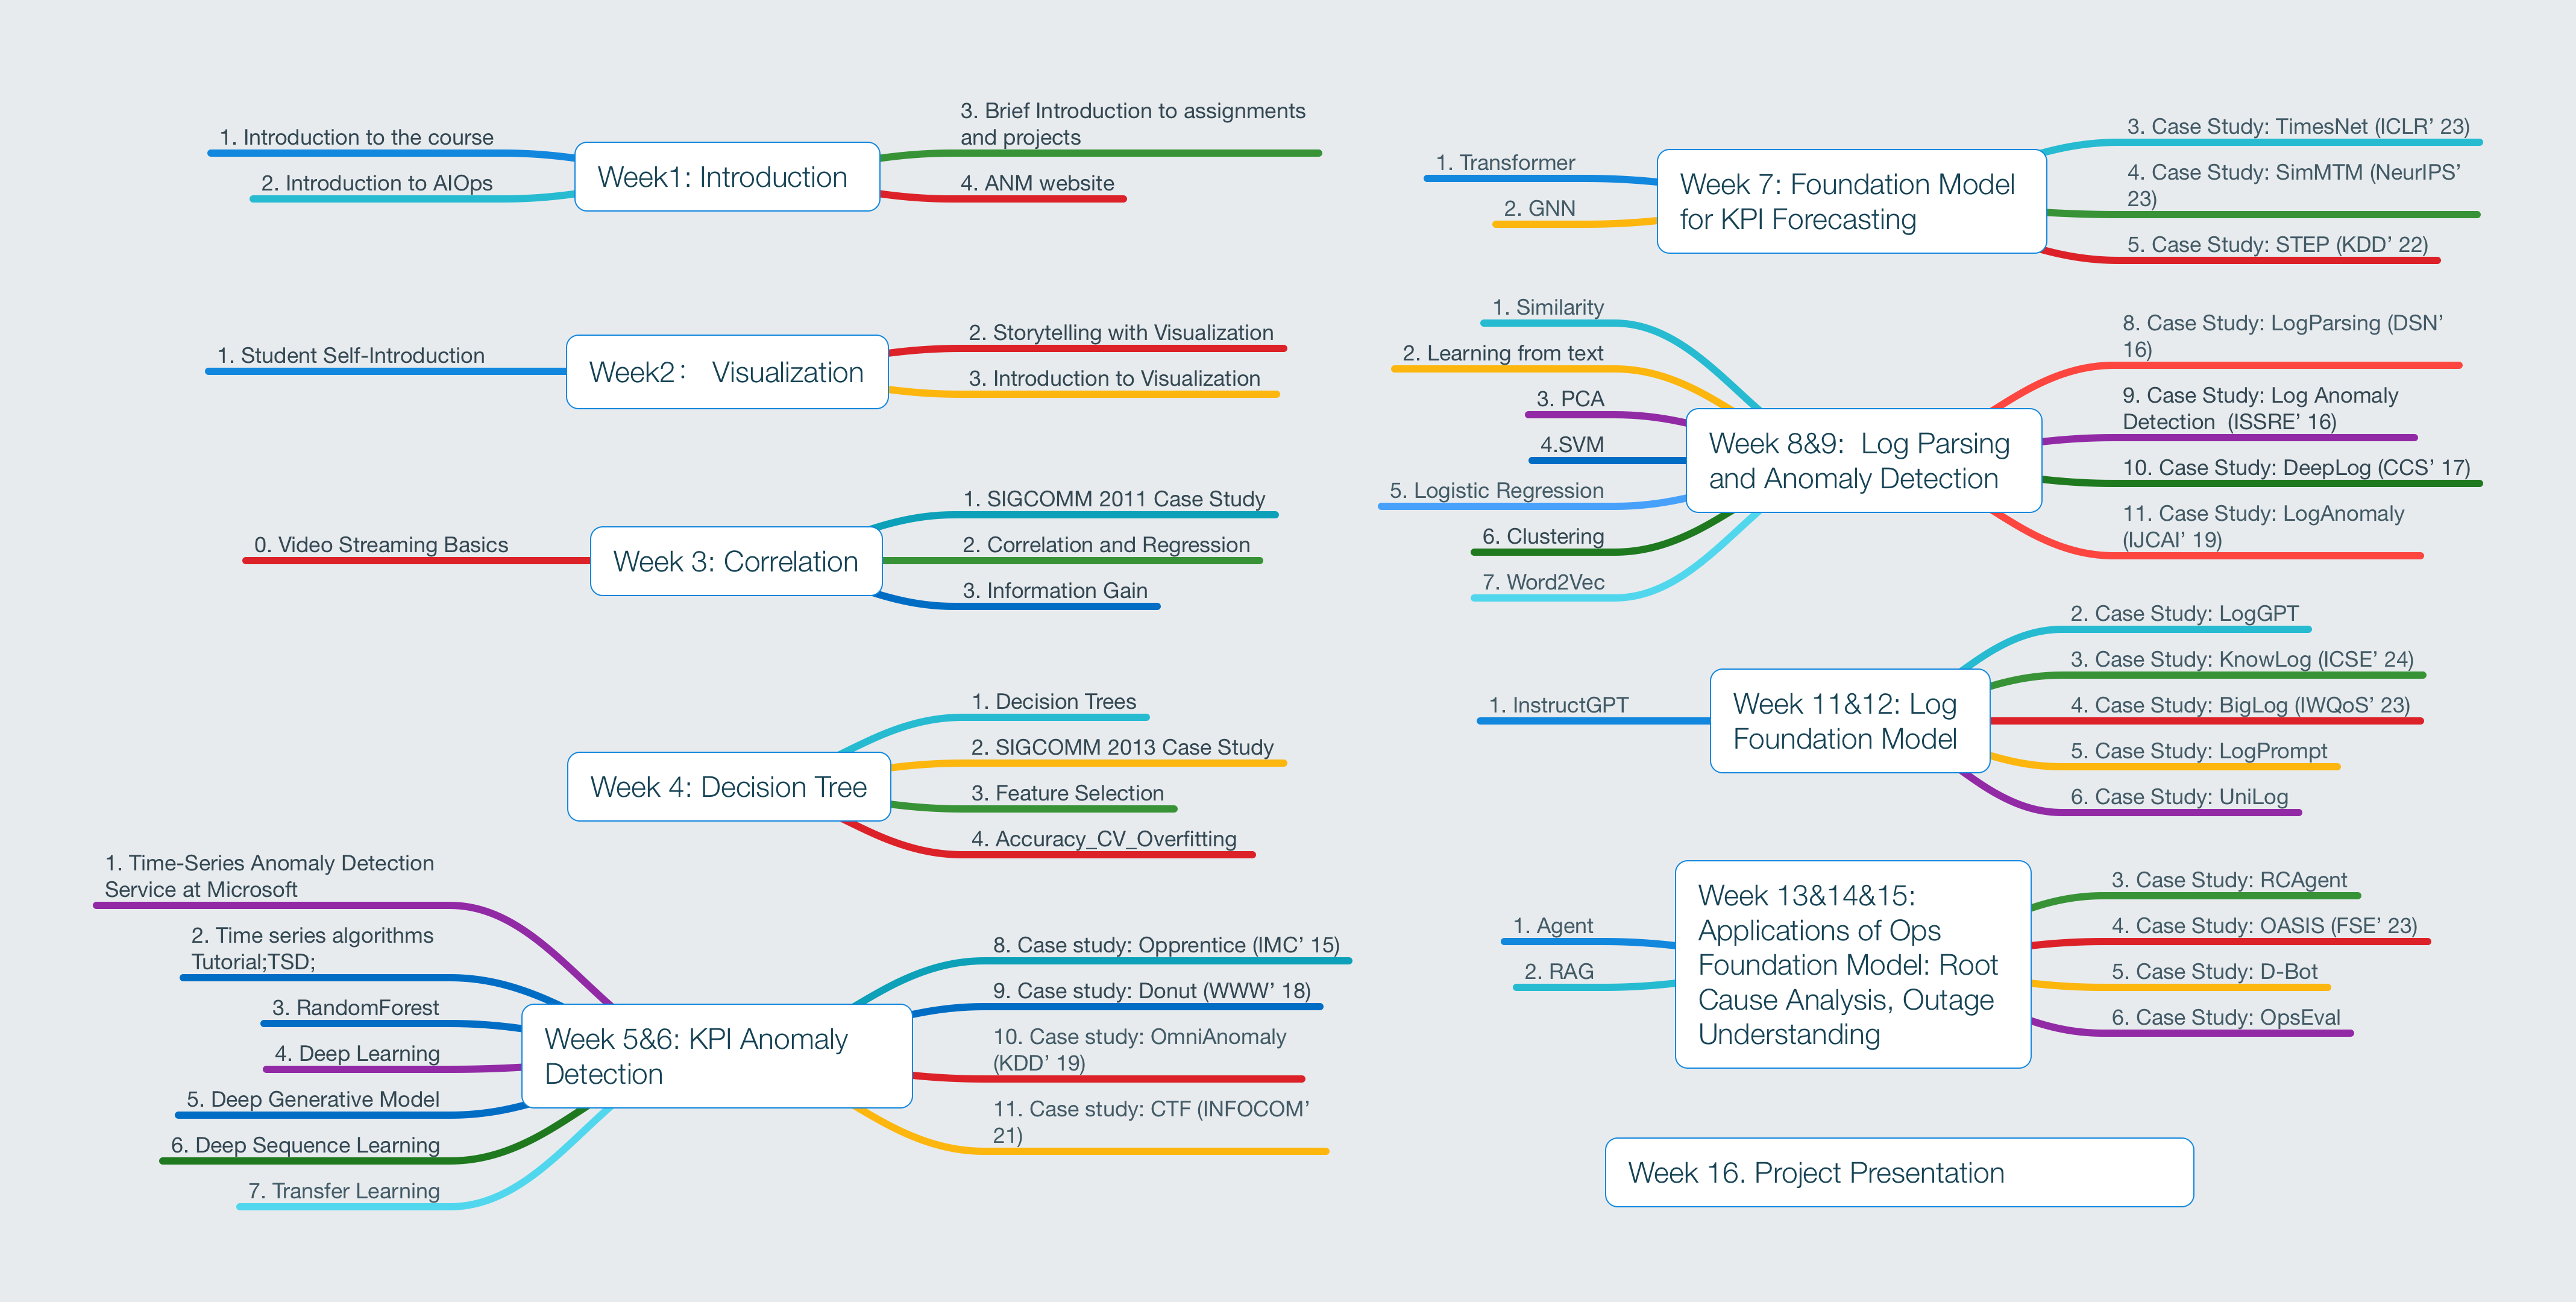
Syllabus:
| Week | Date | Topic, Papers, Slides and Reading List | Algorithms & Techniques |
| 1 | Feb 28 (9:50am-12:15pm) | Course Introduction | |
| 2 | Mar 6 (9:50am-12:15pm) | Quality of Experience of Video streaming | Data Visualization
Correlation, Regression, Information gain, Decision trees, Regression trees |
| 3 | Mar 13 (9:50am-12:15pm) | ||
| 4 | Mar 20 (9:50am-12:15pm) | ||
| 5 | Mar 27 (9:50am-12:15pm) | KPI Anomaly detection | Time series Algorithms. |
| 6 | Apr 3 (9:50am-12:15pm) | ||
| 7 | Apr 10 (9:50am-12:15pm) | Foundation Model for KPI Forecasting | |
| 8 | Apr 17 (9:50am-12:15pm) | Log Parsing & Log Anomaly Detection | |
| 9 | Apr 24 (9:50am-12:15pm) | ||
| 10 | May 1 (No class due to school holidays) | ||
| 11 | May 8 (9:50am-12:15pm) | Log Foundation Model |
InstructGPT |
| 12 | May 15 (9:50am-12:15pm) | ||
| 13 | May 22 (9:50am-12:15pm) | Applications of Ops Foundation Model: Root Cause Analysis, Outage Understanding |
Agent Retrieval Augmented Generation |
| 14 | May 29 (9:50am-12:15pm) | ||
| 15 | Jun 5 (9:50am-12:15pm) | ||
| 16 | Jun 12 (9:50am-12:15pm) | Project Presentation |
Course Information
《MIT 6.S191 Introduction to Deep Learning 》 with video and slides.
《Site Reliability Engineering –How Google Runs Production Systems》, by Betsy Beyer, Chris Jones, Jennifer Petoff & Niall Richard Murphy
Course Assistant
Zhe Xie
Email: xiez22(at)mails(dot)tsinghua(dot)edu(dot)cn
